Using Measures
Welcome to Nine9s! This guide will help you get set up Nine9s to monitor you server's disk usage.
This guide assumes you've already created your account. If you haven't done so already, do that now.
Adding Your First Measure
No subscription required.
In addition to typical uptime monitoring, where Nine9s will periodically check to see if your service is responding to requests, Nine9s also allows your services to push diagnostic data to your account to measure various resources. We call these "Measures".
A Measure can be anything your server can measure. For this guide, we'll be measuring disk usage.
The first thing we need to do is create the Measure. We can do that from your account dashboard. Just give the Measure a name as shown below.
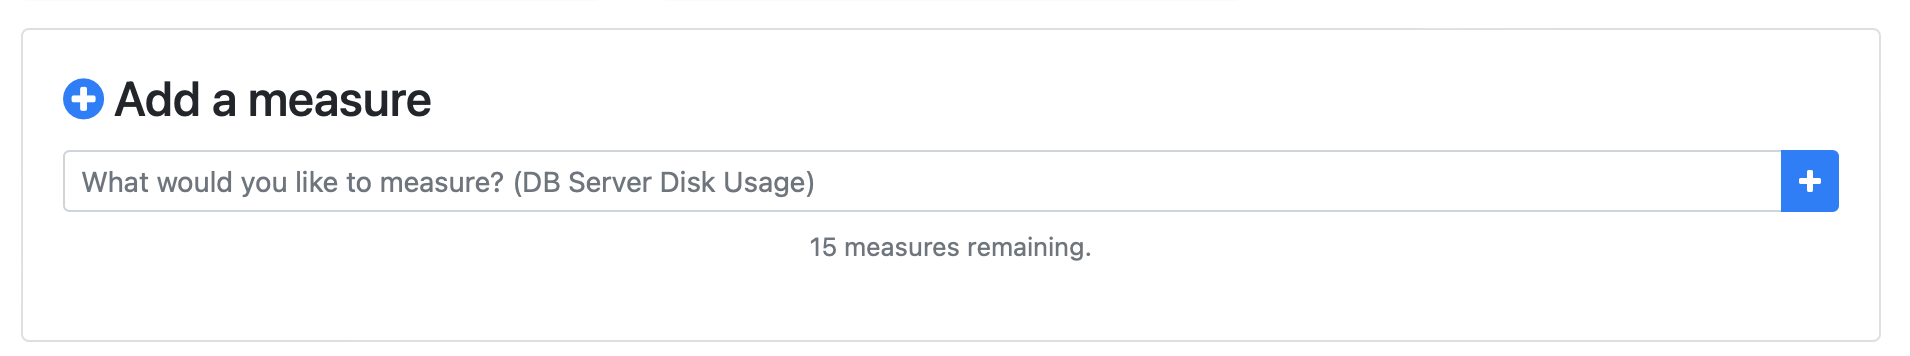
Once we've created the Measure, you'll be able to configure it. Simply click on the new Measure to see more information.
Setting Criteria
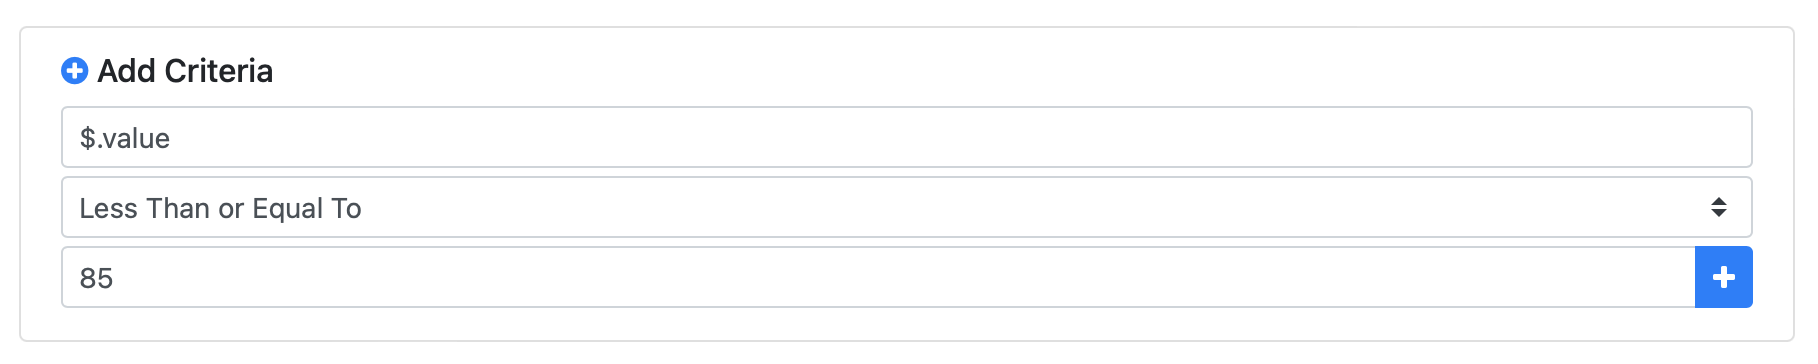
First, we need to tell Nine9s what the acceptable range of values are for our measurement. For this tutorial, let's assume we'd expect our server's disk usage to always be below 85%. That way Nine9s will alert us if the value ever goes beyond that.
Simply add a new criteria where the value is Less than or Equal to a value of 85.
Then click the "+" icon to add that criteria.
Assuming we leave the rest of the settings as is, we can move on to configuring our server to send this data to Nine9s.
Pushing Data to Nine9s
By default, Nine9s expects your services to push data every minute, and the simplest way to do that from a Linux server is with a simple cron job.
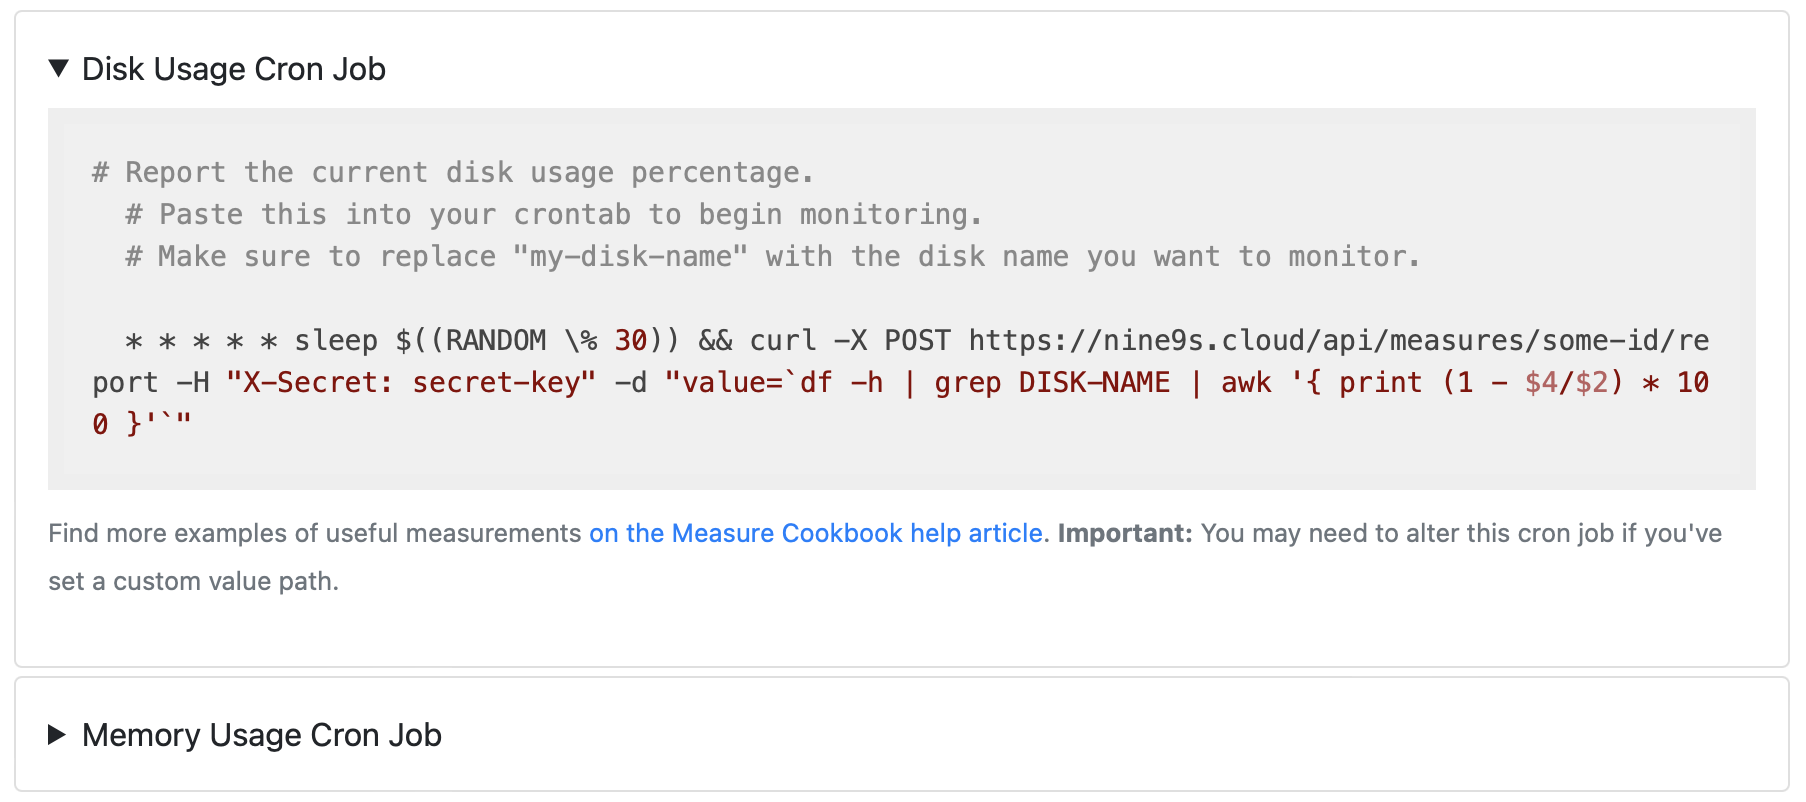
To make the setup as easy as possible, Nine9s automatically generates a couple standard cron jobs you can use on your own servers.
Since we're monitoring Disk Usage, we can click on the "Disk Usage Cron Job" in our new Measure detail page and simply copy that value into our remote crontab file.
Once you've copied it to your clipboard, simply SSH into your server and add the new cron job.
$ ssh user@my.service.com
$ crontab -e
$ <add your new crontab script>
🎉 That's it! Nine9s is now able to monitor your server's disk usage!
Understanding Leeway & Degradation
If your service does not report new measurement data every minute, Nine9s will start a timer and if your service has still not responded after that time, your Measure will be marked as DEGRADED. The amount of time this takes is based on the allowed_leeway value and is measured in minutes.
Essentially, a Measure is considered DEGRADED after 1 + allowed_leeway minutes if no new data is received. You can increase the allowed leeway if your service reports complex data or values that are expensive to compute or if you don't expect your service to routinely report data to Nine9s and don't want to receive degradation notices.